Why are stock returns higher under Democratic Presidents?
There is a long standing “Presidential Puzzle” that stock markets typically perform better under Democratic administrations than Republican ones. At first glance one would ascribe this to chance, but the result is quite robust.
It is also inconvenient for both sides of the political spectrum.
The Republican problem is clearer - lower market returns don’t help their pro-business image. But the current Democratic Party doesn’t highlight this either: over time, Democrats have moved away from market or GDP-related metrics. “Markets are not the real economy” is standard fare in left-leaning circles, so it is borderline embarrassing that stocks do so much better under Democratic Presidents.
Here, a look at the anomaly for more recent Presidencies (since Reagan):

The trend holds all the way back to 1927 - there was an important article on this (at no less than the Journal of Finance) which analyzed data from 1927-1998. But the result has also held true from 1999 to now.
It is quite fascinating to see how large and stable the difference in market returns has been over the past 90 years:
Since 1927 there has been close to zero market excess return under Republican presidents. That is stunning!
Meanwhile, many celebrated strategies, such as Buffet-style value investing, have underperformed for 30 years and counting.
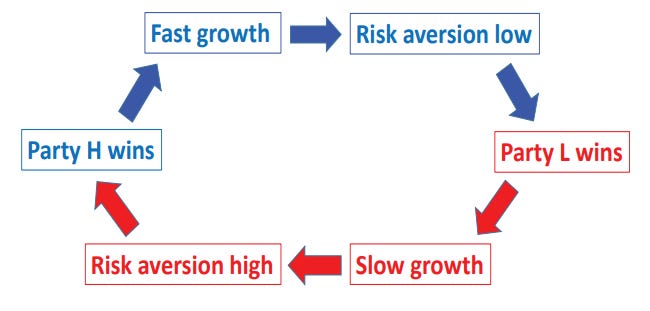
Luckily, a solution to the Presidential puzzle has been proposed by a couple of professors at Chicago’s Booth School of Business. They propose the concept of risk aversion cycles: the idea being that Democrats are elected to the Presidency when the country’s appetite for risk happens to be low (high risk-aversion) and Republicans are elected when risk appetite is high (low risk-aversion). But high risk aversion means that expected returns should also be high because investors should demand higher returns for taking on risk. Thus Democrat Presidencies should, on average, be accompanied by better stock performance.
If correct, this delinks stock market performance from the policy-specifics of the two parties. Instead you have an inherent cycle of risk appetite which goes up and down and if the election happens to coincide with low risk appetite you get a Democratic President and vice-versa.
The authors have other interesting findings that support this hypothesis:
four different proxies for risk aversion tend to decline over the course of a Democratic presidency, consistent with the model. In the cross section, more risk-averse Americans tend to vote Democrat while less risk-averse ones vote Republican, consistent with the idea that more risk-averse individuals avoid business risk but demand social insurance.
If highly risk-averse voters naturally identify as Democrats then “more risky times” should increase Democratic turnout compared to Republicans. The paper was written well before last year’s election, so that could be another out-of-sample observation consistent with this thesis.
I’d even add that this could explain why many democracies have a two-party system. The major “left” and “right” parties may just be people coalescing in high and low risk-aversion grouping. Not to downplay the complexities beneath that, but at first order this may be the case.
From the investment strategy point of view, I think it’s remarkable that risk aversion proxies appear to have been good predictors of market entry and exit points. One could motivate the paper on that basis alone.
Final remark. Since this paper was published, a new presidential puzzle has arisen. This one is nonpartisan and applies to other G7 countries i.e. it is international. I’ll be looking into it more in the coming weeks…
Get this newsletter in your inbox every week!
Please read important disclaimers here. Your use of these materials is subject to the terms of these disclaimers.


